Weekly Market Commentary | October 21st, 2024
Week in Review…
As quarterly earnings come to an end, all major indices ended the week in positive territory, as small caps led with the Russell 2000 ending the week up 1.87%, leading to signs that small cap stocks are continuing their third quarter turnaround this year. Weekly performance for the week ending October 18, 2024:
- The S&P 500 rose last week 0.85%
- The Dow Jones Industrial Average climbed 0.96%
- The Nasdaq finished the week up 0.26%
- The 10-Year Treasury yield ended the week at 4.08%

Last week the market wrapped up quarterly earnings for many of the large U.S. banks and most were able to exceed profit expectations. Drivers of these profits and future economic conditions were key takeaways from the earnings reports. Year-over-year, banks are having to spend more to retain deposits to fund their loan programs and as a result, saw a decrease in net interest margin. The Federal Reserve’s September rate cut should help reduce this cost; however, banks like JPMorgan are still expecting margin compression to continue into the next quarter. On the other hand, a major driver in bank profitability was the Investment Banking and Wealth Management divisions. Looking forward, banks like JPMorgan, Citibank, and Goldman Sachs significantly increased the amount of cash set aside for potential credit losses.
On Thursday, the market received important updates on the overall strength of the economy. Thursday provided two indicators that consumer demand and economic activity remain strong. For starters, the Census Bureau released September month-over-month headline and Core Retail Sales. Core Retail Sales significantly exceeded expectations, coming in at 0.5%, compared to a forecasted 0.1%. The report showed that consumer demand is strong, and by extension, so is the U.S. economy. Because consumer spending accounts for a large percentage of U.S. gross domestic product (GDP), this report is viewed as a bullish indicator for future GDP forecasts.
Thursday also provided an update on crude oil inventories, which is a key indicator of economic activity/demand. Once again, economic activity and demand proved to be robust as oil inventories decreased by 3.991 million barrels.
Friday was headlined by Netflix’s blowout earnings and September housing data. Netflix reported increases in both revenues and net income. The company also reported an increase in total subscribers of 14%. On the housing front, the Census Bureau reported fewer-than-expected new building permits, and the U.S. Department of Commerce reported fewer-than expected housing starts. Both reports indicate the adverse effect higher interest rates are having on builders.
In summary, the economy appears to be doing well, and this strength is being reflected in corporate earnings. However, sluggish housing growth and potential credit losses will need to be monitored going forward.
Spotlight

How Homeownership is Being Redefined by Enviornmental Uncertainty
The numerous environmental and financial challenges resulting from recent natural disasters in the U.S. have left many Americans financially struggling, wondering what might happen next, and if there are any preventative measures that should be taken. According to an analysis published by Nature Climate Change, over 14 million U.S. properties are at risk of flooding, with annual damages exceeding $32 billion. By 2050, these numbers will rise by at least 11%, adding substantial pressure to insurers, mortgage lenders, and property owners.

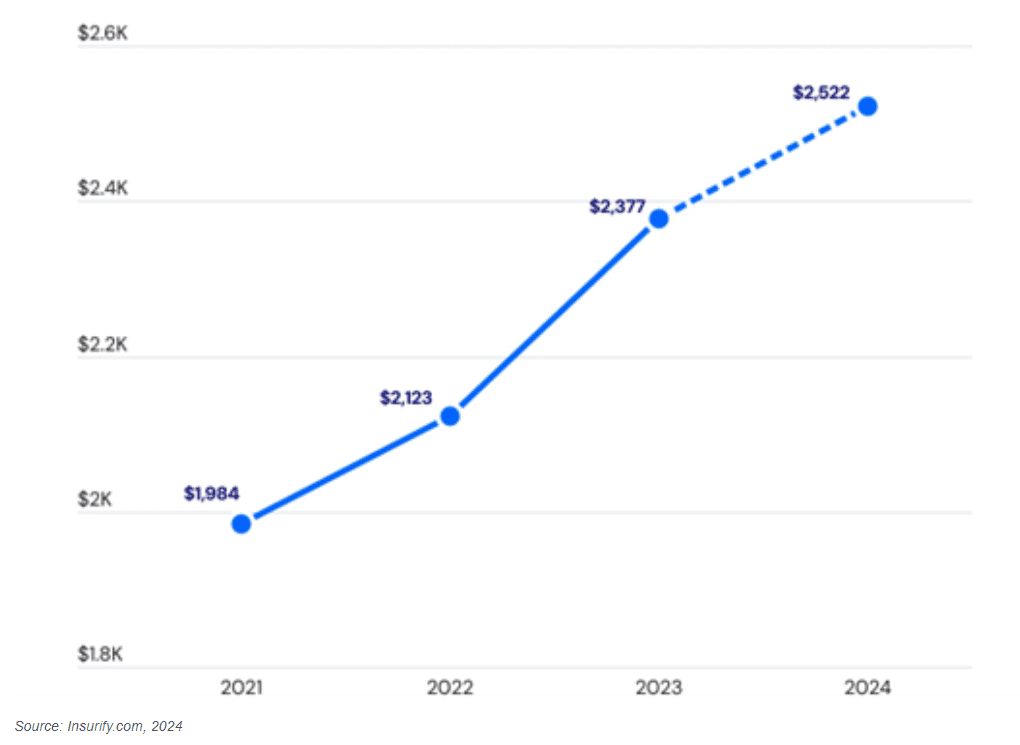
Millions of Americans have been watching with an alarm as their homeowners insurance premiums have risen and their coverage has shrunk in recent years. According to LendingTree, premiums have risen 37.8% nationwide since 2019, and continued to rise 5.8% merely in the first quarter of 2024. As stated by Insurify, if a claim is made, the insurance rates will go even higher, as much as 25%, if you claim a total loss of your home. Because of this, most properties are simply covered with HO-3 (standard), while riders such as flood and earthquake insurance are being passed due to cost.
Average Annual Cost of Home Insurance

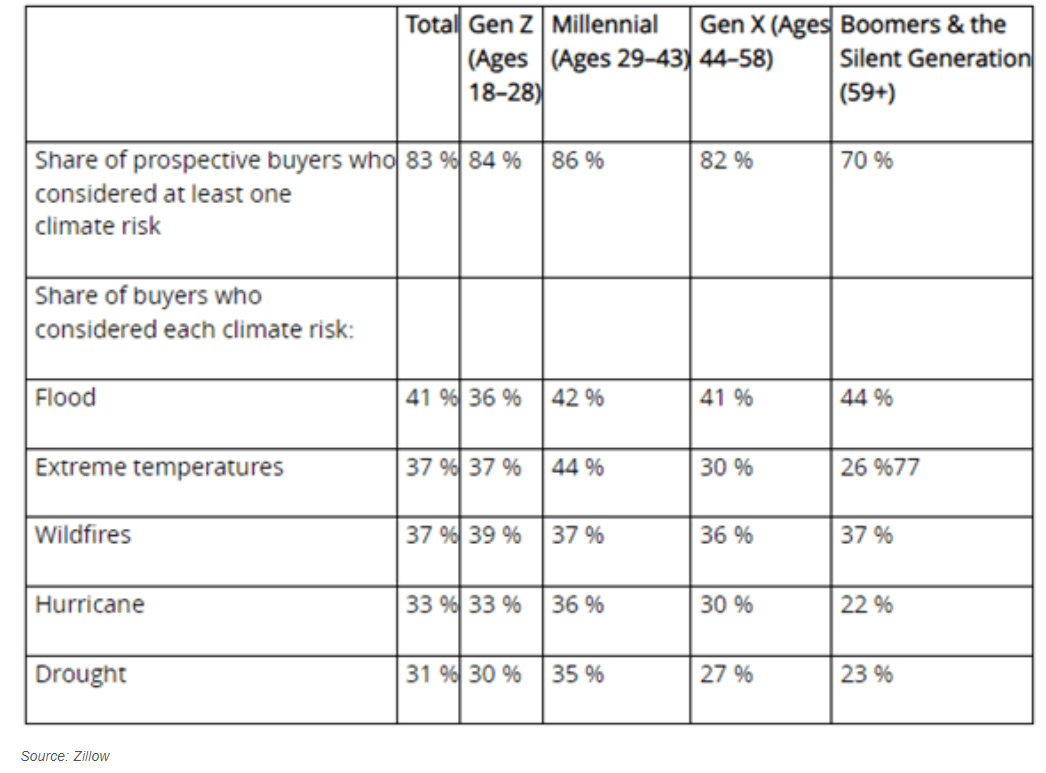
As a result of the increasing premiums from claims and natural disasters, climate risks have become a crucial factor in the home-buying decision. Zillow has stated that more than 80% of potential home buyers now consider climate risks when choosing a home. However, it’s not just about knowing the risks; understanding how they impact long-term affordability, particularly through rising insurance costs, is just as important.
During the house-hunting process, there are five key climate risks that home buyers are considering:
- Flood
- Wildfire
- Wind
- Heat
- Air quality
Climate risks are a major concern for younger home shoppers, who are currently driving the housing market. The median age of today’s home buyer is 39, and first-time buyers make up 50% of all buyers. According to Zillow, Millennial and Gen Z shoppers, who comprise 54% of all home buyers, are most likely to consider climate risk when determining where to shop for a home.
Percentage of Climate Risk Considerations Per Generational Class

As of the beginning of October, all three major house hunting sites (Zillow, Realtor.com, and Redfin) provide ratings for each climate criteria pertaining to the area of every individual listing. Understanding a home’s vulnerability to risks like flooding and wildfires also plays an important role in other aspects of a homeowner’s financial health, such as financial planning, since the cost of insuring a property against climate-related risks can dramatically influence monthly payments and the affordability of a home. For sellers, having a clear understanding of a property’s climate risk can be equally valuable. Sellers can take proactive measures to mitigate hazards, such as flood-proofing or adding fire-resistant landscaping, which can enhance the home’s appeal and market value, and minimize unexpected issues at closing.
With these five published climate-risk criteria, a new concerning trend has emerged — many homes in climate-risk areas are overvalued. For example, a study shows that properties within the 100-year flood zone are priced at about 8.5% higher than they should be, as flood risks are often not fully accounted for in market values. This has sparked fears of a potential real estate bubble in these risky areas, as home prices may eventually deflate, leaving homeowners vulnerable to financial losses. With flood risks not properly factored into home values, many Americans could face significant losses in home equity, causing ripple effects on local governments heavily relying on property taxes.
Municipalities all over the U.S. will need to make their communities more resilient despite climate change. According to Redfin, paying for mitigation and adaptation measures will likely need to be funded through an increase in property taxes and fees. Additionally, as people leave coastal communities due to flooding, or tropical areas due to hurricanes, the tax base in those areas will shrink, further driving up taxes for those that remain.
With increased property taxes and a decrease in the resale value of homes with high climate risk, the local GDP of that area will start to deteriorate due to less economic activity and residential occupancy. Consequently, these areas will start to become underdeveloped, and eventually become deserted. Furthermore, since insurance companies are charging more for coverage in climate-risk areas due to the increased risk that they will have to pay out claims, catastrophe bonds are gaining more market share. These bonds provide the insurance company sources of funding when such a condition occurs, also providing short-term diversification benefits against market and economic risks for the investor.
Week Ahead…

Looking ahead to next week, we anticipate a relatively quiet period for economic data. We will receive the first reports on Existing Home Sales and New Home Sales since the Federal Reserve began cutting interest rates, which will help us assess the current state of the residential real estate market. It’s important to note that the effects of interest rate changes take time to reflect in housing data indicators, and market participants are expecting minimal changes with these upcoming releases.
Market participants will closely monitor the Manufacturing and Services Purchasing Managers Index (PMI) on Thursday. The PMI offers a forward-looking view on the economy’s health, which will help shape the market’s expectations regarding future interest rate cuts.
The University of Michigan’s consumer sentiment data, set for release on Friday, will be closely observed. Last month’s sentiment was 1.2 index points lower than October, but remained well within the margin of error, following two straight months of gains. While inflation expectations have eased substantially, consumers will likely continue to express frustration over high prices. Consumers will likely remain cautious with elevated geopolitical tension and the upcoming election.
This content was developed by Cambridge from sources believed to be reliable. This content is provided for informational purposes only and should not be construed or acted upon as individualized investment advice. It should not be considered a recommendation or solicitation. Information is subject to change. Any forward-looking statements are based on assumptions, may not materialize, and are subject to revision without notice. The information in this material is not intended as tax or legal advice.
Investing involves risk. Depending on the different types of investments there may be varying degrees of risk. Socially responsible investing does not guarantee any amount of success. Clients and prospective clients should be prepared to bear investment loss including loss of original principal. Indices mentioned are unmanaged and cannot be invested into directly. Past performance is not a guarantee of future results.
The Dow Jones Industrial Average (DJIA) is a price-weighted index composed of 30 widely traded blue-chip U.S. common stocks. The S&P 500 is a market-cap weighted index composed of the common stocks of 500 leading companies in leading industries of the U.S. economy. The NASDAQ Composite Index is a market-value weighted index of all common stocks listed on the NASDAQ stock exchange.
