
Broad equities were mixed for the week with the Nasdaq posting a fifth straight weekly gain.
- The S&P 500 was flat for the week, gaining 0.03%
- The Dow Jones Industrial Average was down by 2.33%
- The Nasdaq Composite finished higher by 1.41%
- The 10-Year Treasury closed at 4.46%
The economic calendar was relatively quiet at the beginning of the week as investors looked ahead to the Fed’s meeting minutes being released on Wednesday. The minutes gave market participants an insight into the current economy and the expectations set out by the Fed. The Fed was quoted stating that there has been a “lack of further progress” in bringing inflation down and that their confidence in reaching their 2% goal has decreased due to recent economic data, suggesting disinflation would take longer than previously expected.
Initial jobless claims for the week were released on Thursday, indicating a hotter labor market than the previous two weeks. Also on Thursday, Markit released the services and manufacturing purchasing managers’ index (PMI), measuring the conditions of the services and manufacturing sectors. Recent readings for both sectors indicate they are in expansion territory due to having two consecutive readings above 50. Economists will be watching to see if this continues.
Friday saw durable goods orders for the month of April being released, measuring the change in the total value of new orders for manufactured goods. The most recent three readings have shown a trend of increased spending on long-lasting goods. That same day, the weekly U.S. Baker Hughes oil rig count was released, indicating no change to the price of oil with a measure that was consistent to the previous week’s 497 rigs.

Corporate Earnings Update
Earnings season is just about wrapped up, with 96% of all S&P 500 companies having reported their first-quarter results as of May 24. Corporate earnings are not only helpful in assessing the financial health of an individual company, but they can also provide useful insights into the health of the economy as a whole.
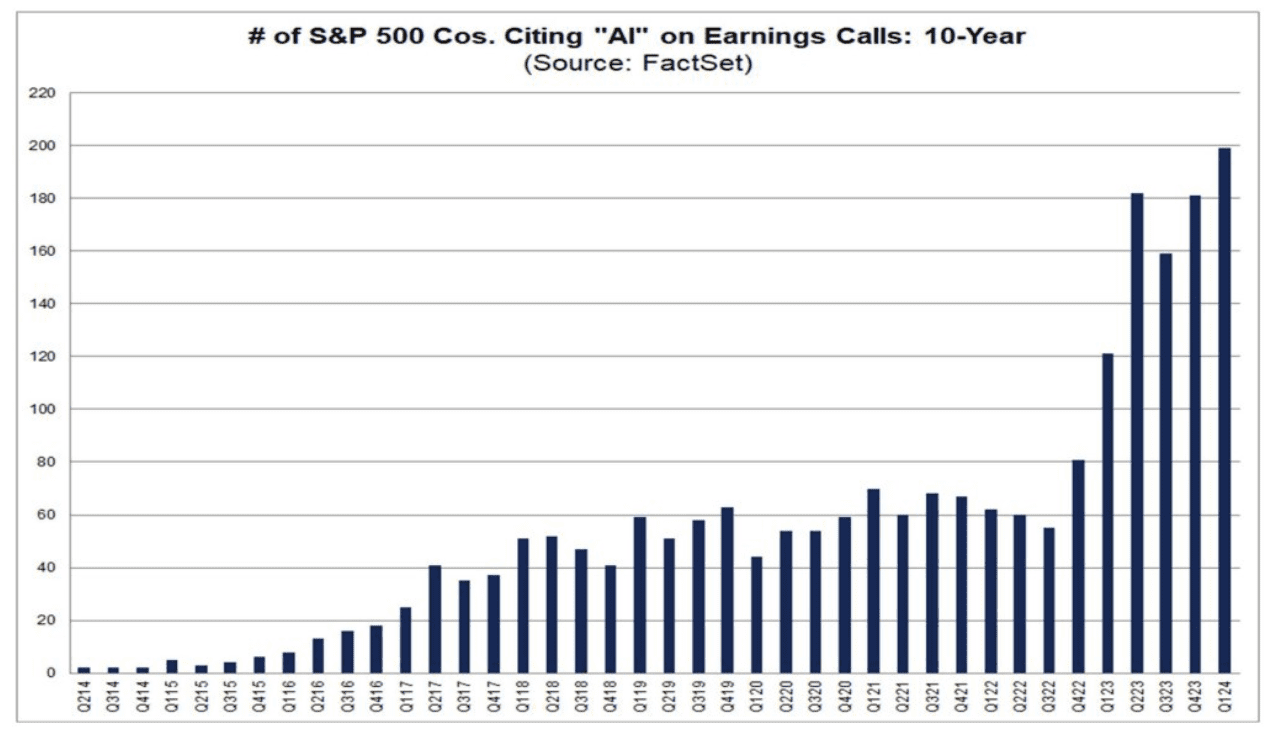
Two key themes that have been driving markets over the past couple of years are inflation and the enthusiasm surrounding artificial intelligence. In fact, companies in the S&P 500 index mentioned artificial intelligence (AI) the most amount of times since data collection began in 2014.


The mention of artificial intelligence is not limited to the technology or communications sectors. Among the S&P 500 companies that reported earnings as of last Friday, 199 firms mentioned AI at some point during their earnings calls. To put this number into historical context, the five-year average was 80 firms, while the 10-year average was only 50 companies. Out of those 199 firms, 50 companies in the technology sector alone mentioned AI in their earnings call. Something perhaps more interesting is that the industrials sector was the second highest with 30 companies mentioning AI during their earnings calls.
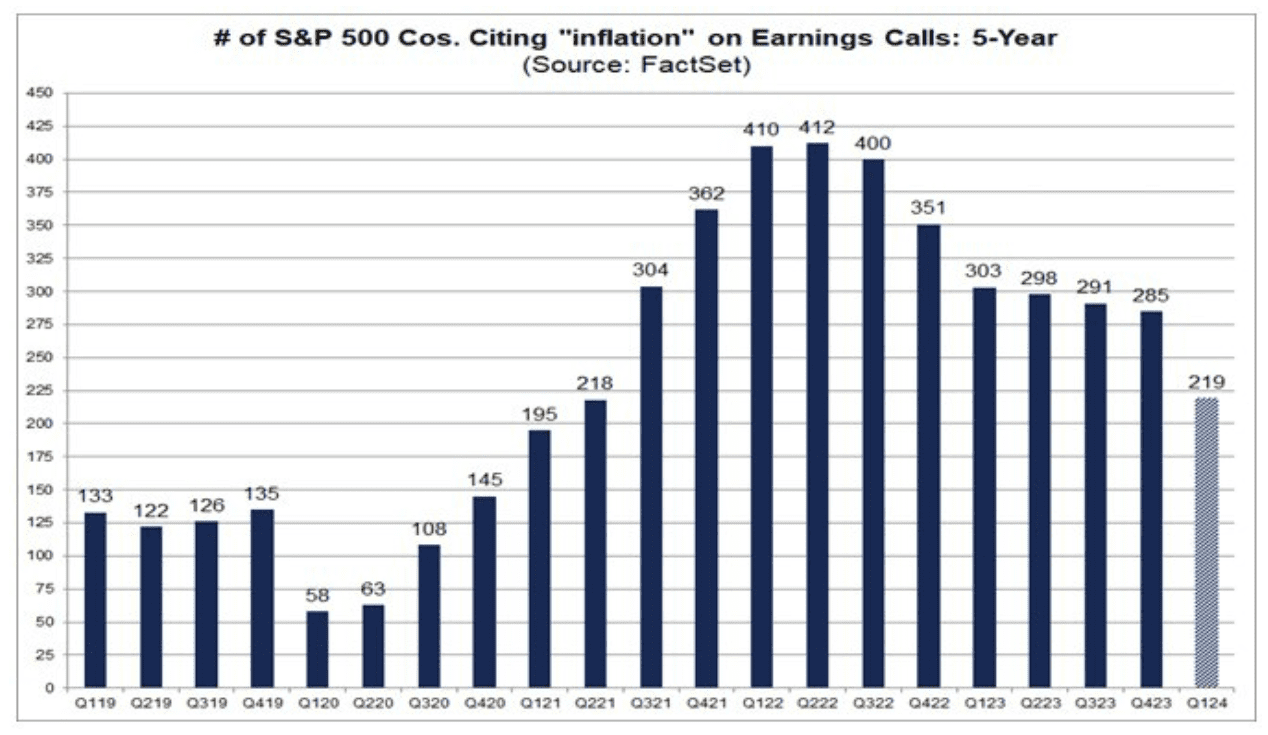
Inflation has also been a significant theme driving markets since the COVID-19 pandemic. In 2022, virtually all firms in the S&P 500 Index mentioned inflation at some point during their earnings calls. That has since slowed down to the lowest level since the second quarter of 2021.

This marks the seventh consecutive decline in the number of firms mentioning “inflation” in their earnings calls. Despite this decline, the 219 companies citing inflation in their earnings calls still exceeded the 10-year average of 180. Among these 219 companies, 24 mentioned the term at least 10 times.
When looking at the market more broadly, about 78% of companies in the S&P 500 index reported a positive earnings surprise. This is above the 5- and 10-year averages of 77% and 74%, respectively. The magnitude of those earnings also beat expectations with first quarter earnings growing by 6% — the highest year-over-year growth rate since the first quarter of 2022.
In terms of valuations, the 12-month forward price-to-earnings ratio currently sits at 20.5, which is slightly higher than the 5-year average of 19.2 and the 10-year average of 17.8.

With markets closed on Monday due to Memorial Day, investors will turn their attention to the remainder of the week to gain insights into the status of the economy as well as to how consumers are feeling about navigating such times.
The economy’s primary health indicator, gross domestic product (GDP), will be released on Thursday. A reading that is higher than the forecasted 1.6% change would indicate a bullish economy which could potentially have a negative impact on the Fed’s decision to lower rates.
On Friday, the Conference Board will release their Consumer Confidence measure for the month of May, which will illustrate if consumers are optimistic or pessimistic about the economy. The Fed’s preferred inflation measure, the Personal Consumption Expenditure (PCE) Price Index, for the month of April will measure the change in the price of goods and services purchased by consumers. The previous two readings showed a 0.3% change in PCE; economists will be watching to see if this trend continues. Additionally, personal spending for the month of April will be released, measuring the change in the value of all spending by consumers. Readings from the previous two months have consistently stayed at 0.8%, surpassing the forecasted amount.
This content was developed by Cambridge from sources believed to be reliable. This content is provided for informational purposes only and should not be construed or acted upon as individualized investment advice. It should not be considered a recommendation or solicitation. Information is subject to change. Any forward-looking statements are based on assumptions, may not materialize, and are subject to revision without notice. The information in this material is not intended as tax or legal advice.
Investing involves risk. Depending on the different types of investments there may be varying degrees of risk. Socially responsible investing does not guarantee any amount of success. Clients and prospective clients should be prepared to bear investment loss including loss of original principal. Indices mentioned are unmanaged and cannot be invested into directly. Past performance is not a guarantee of future results.
The Dow Jones Industrial Average (DJIA) is a price-weighted index composed of 30 widely traded blue-chip U.S. common stocks. The S&P 500 is a market-cap weighted index composed of the common stocks of 500 leading companies in leading industries of the U.S. economy. The NASDAQ Composite Index is a market-value weighted index of all common stocks listed on the NASDAQ stock exchange.
