
Equity markets reacted positively to CPI news with the Russell 2000 having a breakout week, finishing up 6%. The other broad indices were up, with the Dow leading.
- The S&P 500 was up for the week, gaining 0.87%
- The Dow Jones Industrial Average led, ending up 1.59%
- The Nasdaq Composite was up by 0.25%
- The 10-Year Treasury closed at 4.18%
Monday began with consumer inflation expectations, which were 3%, under the consensus estimates of 3.2%, supporting a soft-landing perspective. As of this year, consumer inflation expectations have remained tightly between 3% and 3.3%.
Thursday was heavy with data, beginning with seeing initial jobless claims come in at 222,000, under the estimate of 236,000, indicating a stable jobs market. Continuing jobless claims were in line with estimates, however, at 1,852,000. At the same time, the Consumer Price Index (CPI) was released for the month of July, coming in -0.1% to June’s reading, the first negative month over month print since January 2023. On a yearly basis, the CPI was 3% higher than last year, under the forecast of 3.1%.
To end the week, the Producer Price Index, a measure of prices of products from manufacturing firms, was released, coming up at 0.1% month-over-month, as opposed to the expected 0% change. Later in the trading day the University of Michigan Consumer Expectations index was released, coming in at 67.2 compared to the 69.8 which was forecasted, which can be interpreted as a bearish outlook for the U.S. dollar and a positive factor in the expectation for rate cuts.

Top-Heavy Leadership in the S&P 500
The recent performance of the S&P 500 – with a strong Q2 up over 4% and an approximately 18% increase year-to-date (YTD) – is a testament to the power of Big Tech. This week we take a deep dive underneath the returns to see how top-heavy names in the index have led the performance and the historical impacts of a top-heavy S&P 500.
The six tech giants with trillion-dollar market caps have been the driving force behind this performance, delivering an average return of 16.8% in Q2. However, it’s important to note that the remaining 494 companies in the index produced a negative return of (0.8%) during the same quarter. This top-heavy leadership in the S&P 500 has been a trend for the last year and a half, largely driven by the growing interest in generative AI. These major players in the AI space are enjoying lofty valuations given their outlook for stronger growth amidst elevated macro uncertainty.

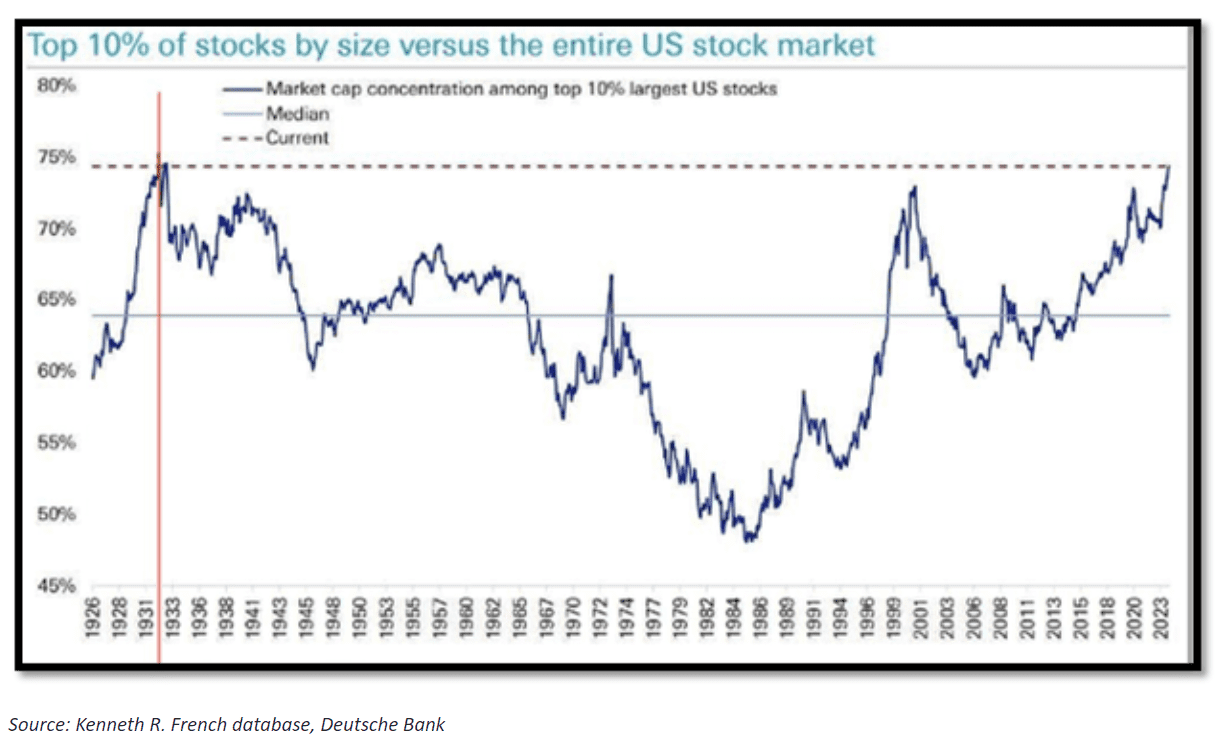
The concentration of market power in the hands of the 10 largest companies, which now account for 38% of the S&P 500’s overall market cap, is reaching levels last seen during the Great Depression. While some investors are viewing this as a bubble waiting to burst, others see it as a sign of the times, with technology and innovation being the new drivers of economic growth.

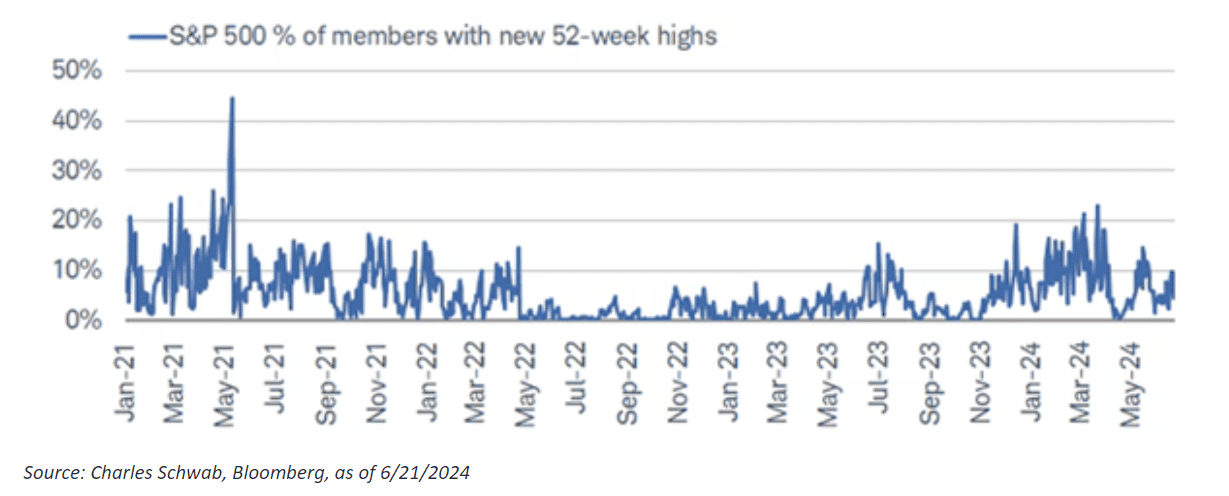
While the S&P 500 has repeatedly shattered its all-time highs throughout the year, and is currently trading at an all-time high, a compelling divergence emerges: less than 10% of the companies within the index are trading at 52-week highs. While it’s certainly not realistic for every member to reach new highs simultaneously, even in bull markets, there has been gradual deterioration over the past few months. This discrepancy further highlights the top-heavy nature of the market, where a handful of mega cap companies are driving overall performance while many others lag behind.

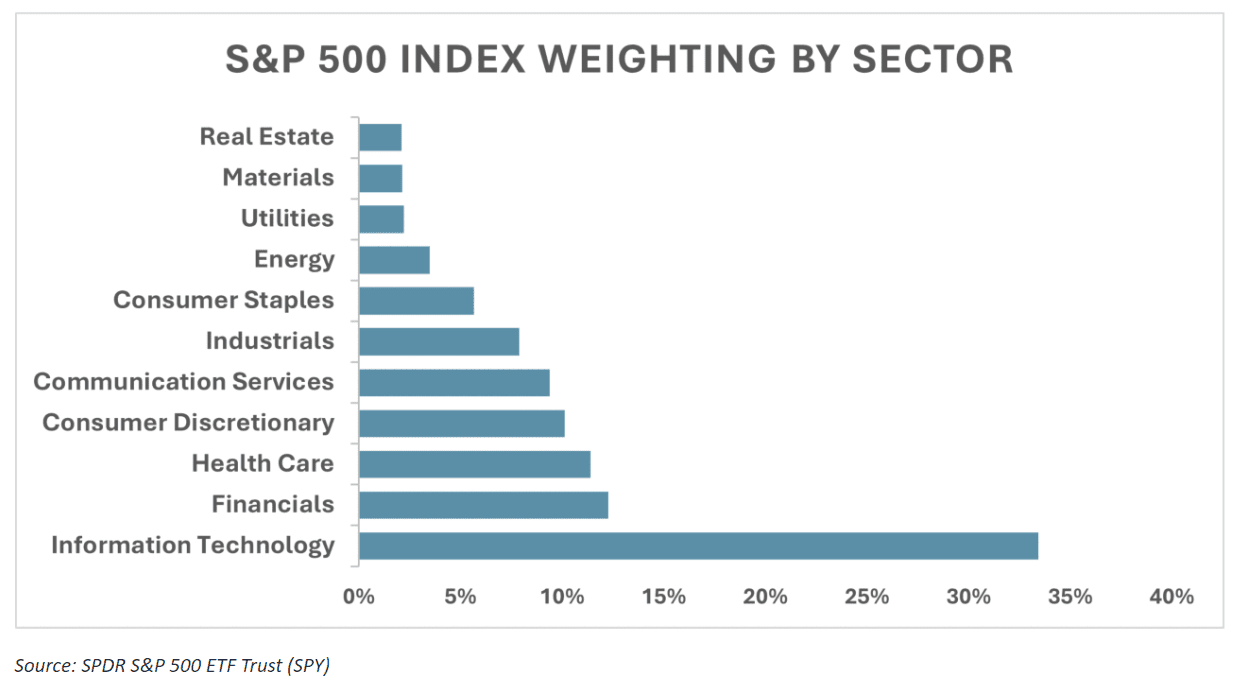
On the subject of concentration, let’s consider the current weightings within the S&P 500 Index by sector, as of July 10. The Information Technology sector currently constitutes 33.4% of the index, which is over 2.7 times larger than the next heavily weighted sector, Financials. Over the past 20 years, Information Technology has held an average weighting of 17.5% in the Index. Currently, Financials, Health Care, and Consumer Discretionary all hold double-digit weightings in the Index, with 12.3%, 11.4%, and 10.1% weightings, respectively.

The current equity landscape is a complex one, with Big Tech leading the charge and smaller companies struggling to keep up. At times like these, it can be helpful to focus on diversification in an effort to prevent over-exposure to certain companies or sectors.

The week begins with Fed Chair Powell speaking. Traders will be watching his speech for clarity on the timing of potential rate cuts. On Tuesday, core retail sales, which are a measure of consumer spending and a pace indicator of the US economy, are released for the month. Current consensus estimates place the number 0.1% higher than last month.
Wednesday will provide an outlook into Crude Oil Inventories. The Energy Information Administration provides total holdings of commercial crude, with a higher inventory indicating low demand and vice versa. Additionally, petroleum products and their pricing play a role in U.S. inflation. Thursday will mark the initial jobless claims, a measure on the health of the U.S. labor market. Simultaneously, the Philadelphia Fed Manufacturing Index is released, which will provide context into manufacturing conditions, and their implications on inflation.
To end the week, traders will hear from the New York Fed President Williams, followed by Atlanta Fed President Bostic. While Powell has the most swing over rate decisions, the two Fed presidents will provide context and potential second opinions as to what the Federal Open Market Committee (FOMC) is looking for, and how they are interpreting the newest data.
This content was developed by Cambridge from sources believed to be reliable. This content is provided for informational purposes only and should not be construed or acted upon as individualized investment advice. It should not be considered a recommendation or solicitation. Information is subject to change. Any forward-looking statements are based on assumptions, may not materialize, and are subject to revision without notice. The information in this material is not intended as tax or legal advice.
Investing involves risk. Depending on the different types of investments there may be varying degrees of risk. Socially responsible investing does not guarantee any amount of success. Clients and prospective clients should be prepared to bear investment loss including loss of original principal. Indices mentioned are unmanaged and cannot be invested into directly. Past performance is not a guarantee of future results.
The Dow Jones Industrial Average (DJIA) is a price-weighted index composed of 30 widely traded blue-chip U.S. common stocks. The S&P 500 is a market-cap weighted index composed of the common stocks of 500 leading companies in leading industries of the U.S. economy. The NASDAQ Composite Index is a market-value weighted index of all common stocks listed on the NASDAQ stock exchange.
