Market Commentary | August 19th, 2024
Week in Review…
Broad equity markets roared higher for the week as investors reacted positive to inflation readings and a stronger-than-expected jobless claims report:
- The S&P 500 was up 3.93%
- The Dow Jones Industrial Average increased by 2.94%
- The Nasdaq Composite led major indices ending up 5.29%
- The 10-Year Treasury closed at 3.88%
Consumer inflation expectations were measured on Monday for the month of July, coming in at 3%. Inflation expectations have consistently stayed around 3% each month since January 2024.
Midway through the week, changes in the price of goods and services were measured for the month of July through the consumer price index (CPI), which revealed a 2.9% year-over-year increase, marking the second consecutive month below 3%, and the lowest level since March 2021. Additionally, Core CPI rose by 3.2% annually, reaching a 40-month low, suggesting a gradual but favorable inflation trend. Furthermore, the latest wholesale inflation report or producer-price index (PPI), which measures the prices businesses receive for their goods and services, rose 0.1% in July, which was less than the 0.2% month-over-month increase economists had been expecting. On an annual basis, PPI increased 2.2%, the smallest year-over-year increase since March. Stripping out volatile food and energy prices, the Core PPI figures showed no change from July.
Later in the week, weekly continuing jobless claims pointed bullish for the labor market with a reading of 1,864, lower than the previous and forecasted numbers. Readings from the previous two weeks have increasingly measured more continuous claims compared to the prior. Furthermore, the University of Michigan released their Consumer Expectations Index for the month of August, showing that consumers are anticipating a hot economy with the reading coming in at 72.1, higher than the previous reading of 68.8.
Spotlight

First Half Market Update
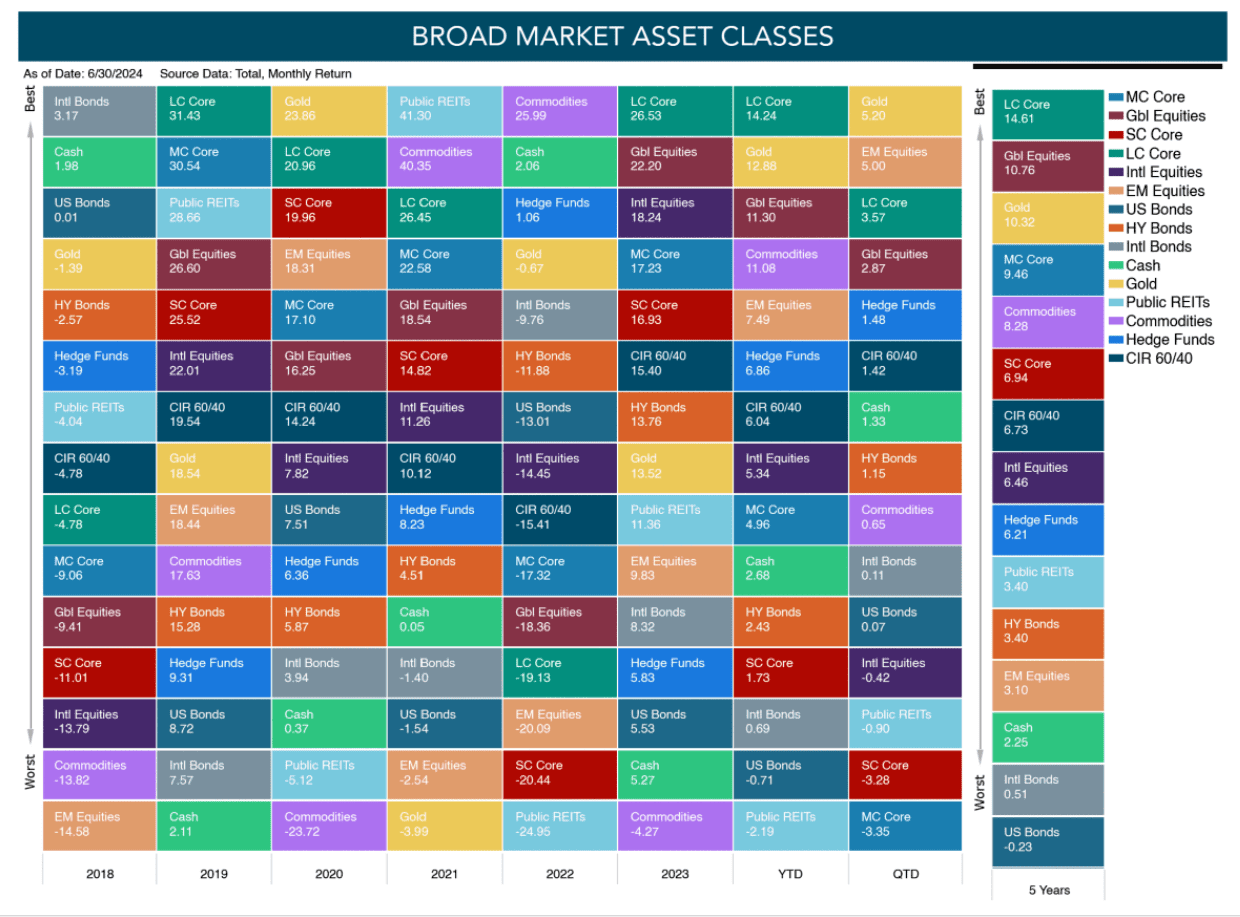
As we move closer toward the end of summer and further into Q3, we take a look at the first half of the year to get an overview of what asset classes performed well in both equities and fixed income.
Source: Morningstar Direct
Source: Morningstar Direct
Broad markets continue to be dominated by equities, specifically U.S. equities. Gold has also performed well as investors continue to invest in the asset as a hedge against deteriorating purchasing power and geo-political risks.
After rebounding last year, real estate (public real estate investment trusts, or REITs) has struggled year to date as interest rates remain elevated. Treasury bonds continue to struggle as well for similar reasons.
Alternative asset classes such as hedge funds and commodities have provided some modest returns for clients who have allocated away from bonds into these strategies.
Source: Morningstar Direct
Source: Morningstar Direct
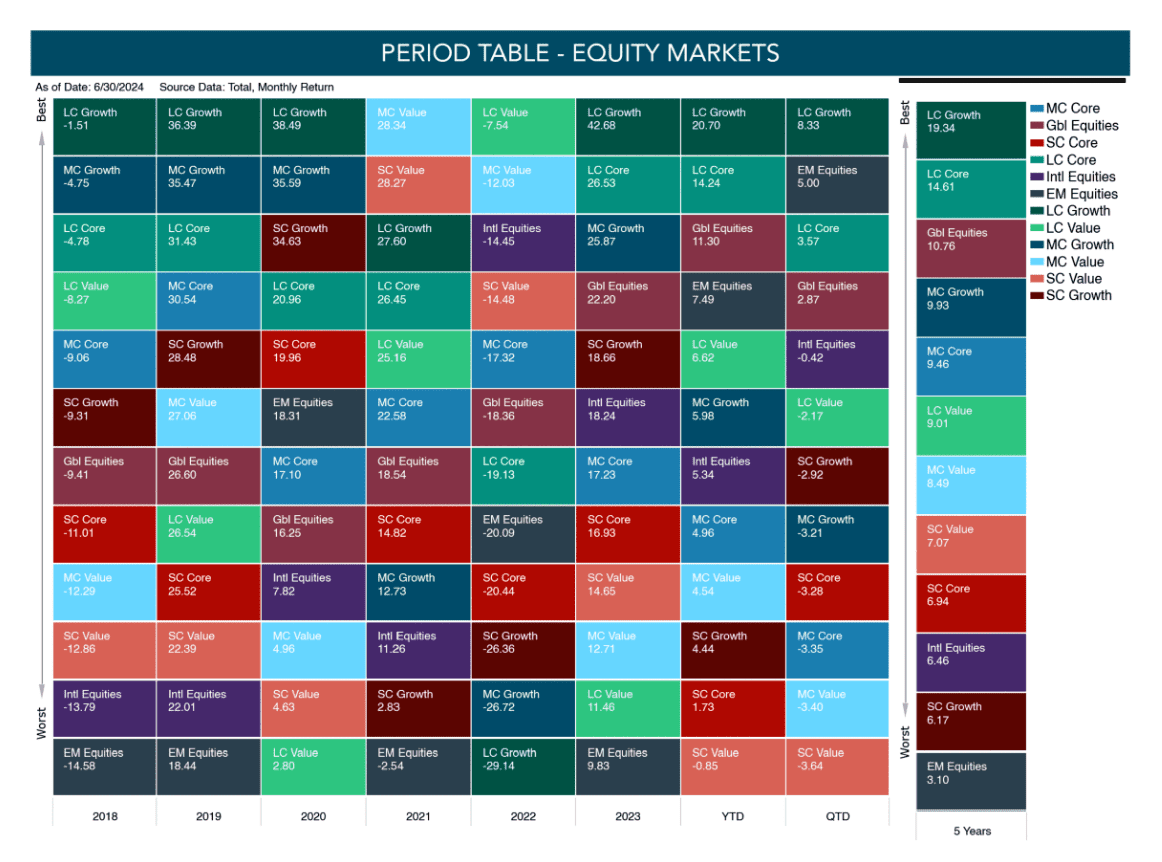
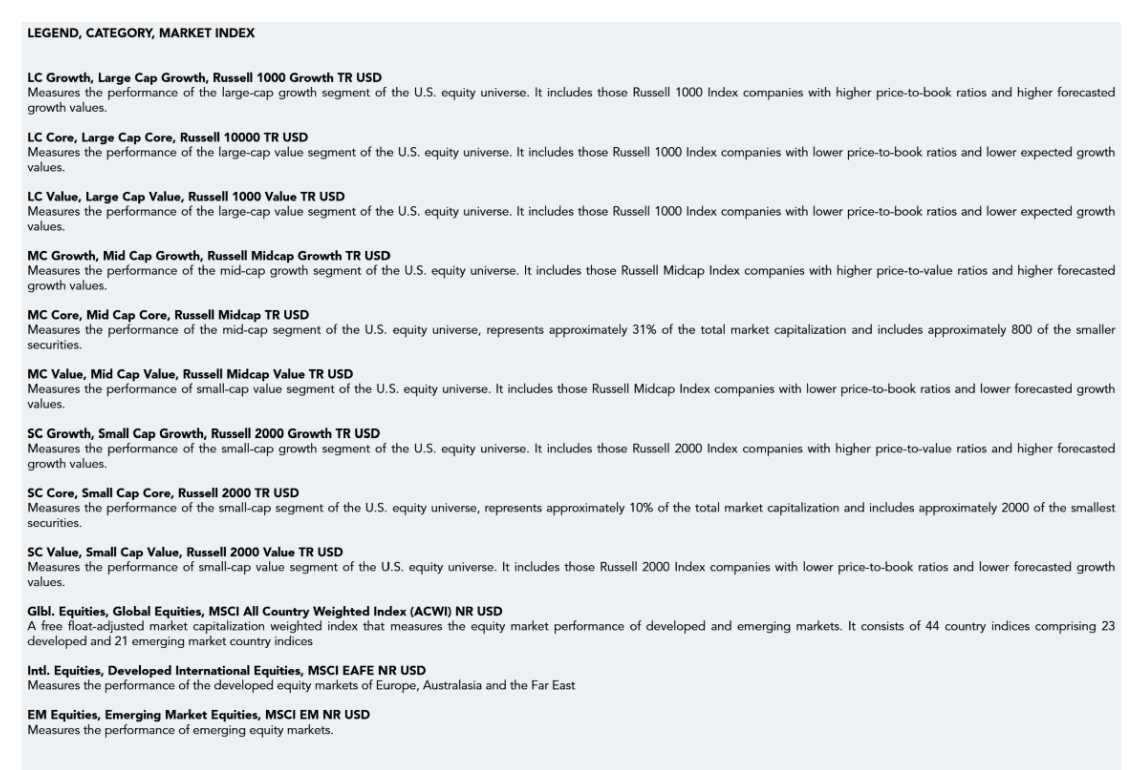
For equities, the first half of 2024 was characterized by the same pattern that investors have experienced over the last few years, with mega cap tech stocks outperforming all the other sectors. This continued to lead the S&P 500 and Nasdaq to all-time highs; the S&P 500 posted 31 record highs for the year. This was in sharp contrast with the Russell 2000 small cap index which had not hit a fresh high since 2021, the third longest stretch since the dot-com bubble burst.
Given the difference in performance between large and small-cap stocks, the differential in their price-to-earnings ratios was one standard deviation from their average.
Market performance continued to be narrow with only two of the 11 Global Industry Classification Standard (GICS) sectors outperforming the S&P 500 in the first half of the year. Perhaps more interestingly, there were more stocks at their 52-week lows than 52-week highs in the S&P 500 for the first time ever, as most of the returns were driven by only four stocks: Microsoft, Nvidia, Meta, and Alphabet.
Source: Morningstar Direct
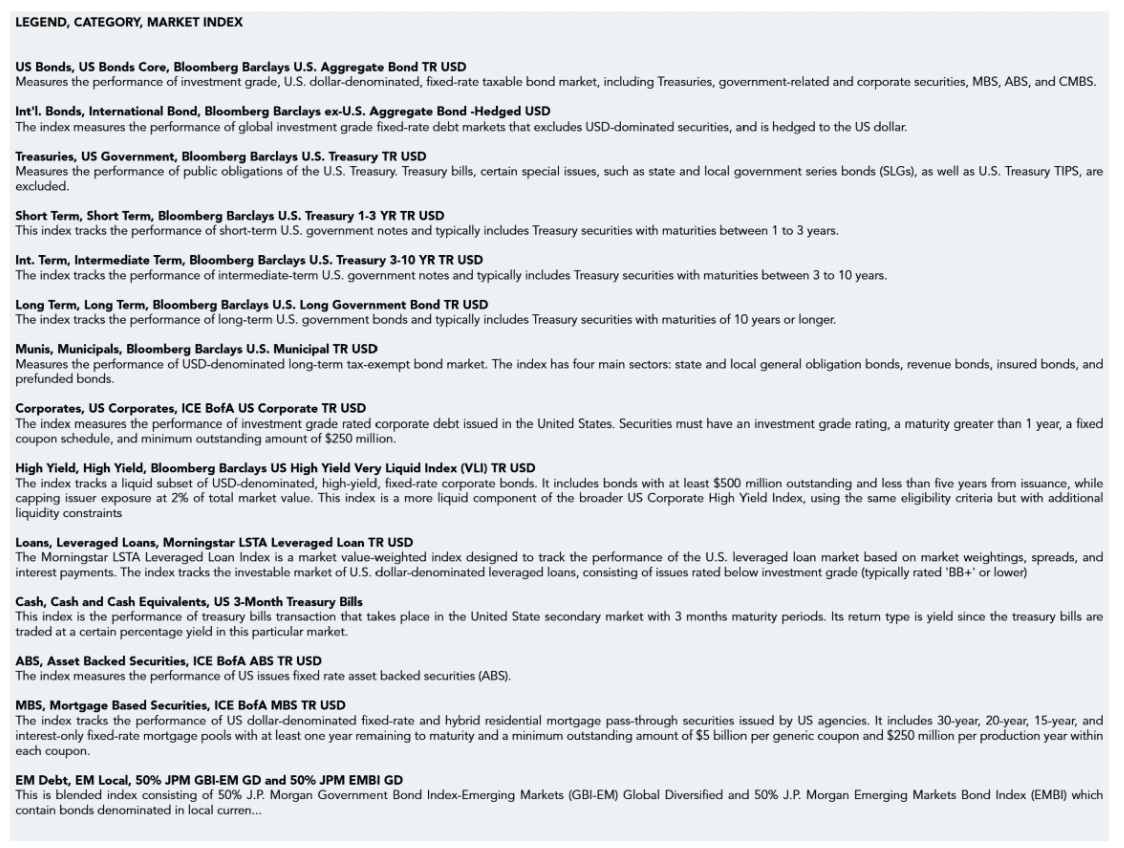
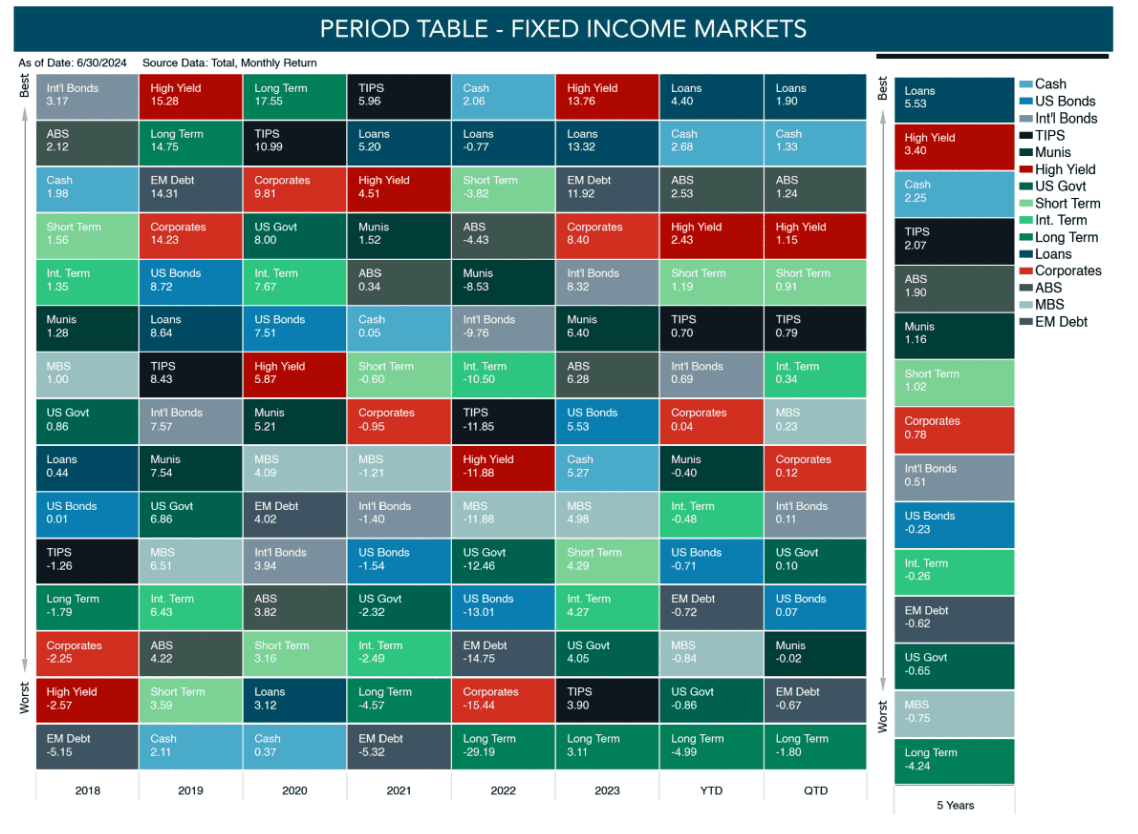
Fixed income has been a redux of 2022, as the barbell approach of risk-free cash and risky floating rate loans (loans) have been the top two sectors. Loans continue their dominance of being one of the top two sectors in fixed income over the last three and half years.
On the flip side, duration-heavy Treasuries have continued to underperform versus other fixed income sectors. Additionally, U.S. Treasuries have lagged as rates had continued to climb earlier in the year.
High yield bonds continue to outperform investment grade bonds, but asset-backed securities (ABS) have slightly outperformed year-to-date as the sector has shaken off concerns about a weakening consumer.
Past performance is no guarantee of future results. Indices mentioned are unmanaged and cannot be invested into directly. The information provided herein is for general informational purposes only and should not be construed as personalized financial guidance.
Week Ahead…

The week will provide consumers with indicators that will aid them in gauging the current state of the economy.
Toward the beginning of the week, the Federal Open Market Committee (FOMC) will release their meeting minutes, providing consumers with insights into the possible rate cuts in September, along with details such as how many and how large.
Further in the week, the weekly initial jobless claims will be released by the Department of Labor, gauging the state of the labor market. The previous two weeks have shown indications of a hot market due to decreasing claims each week, stipulating companies are actively hiring. That same day, the Manufacturing and Services Purchasing Managers’ Index (PMI) for August will be released, enlightening consumers to the status of such industries. Previous readings have shown a pivot in the overall conditions of both industries.
Rounding out the week, consumers will decipher the status of the housing market through the existing and new home sales readings for July. Recent readings have shown a decrease in the number of sales throughout the industry, however mortgage rates just decreased by 1%, so future readings may be looking up. Economists will be watching to see if this continues. Furthermore, the weekly U.S. Baker Hughes active oil rig count will measure the number of active rigs, which will provide consumers with an insight into the possible increase or decrease in the price of petroleum. A reading with more active rigs means there is an increase in demand, which in turn will increase prices.
Please see the section below for important disclosures.
This content was developed by Cambridge from sources believed to be reliable. This content is provided for informational purposes only and should not be construed or acted upon as individualized investment advice. It should not be considered a recommendation or solicitation. Information is subject to change. Any forward-looking statements are based on assumptions, may not materialize, and are subject to revision without notice. The information in this material is not intended as tax or legal advice.
Investing involves risk. Depending on the different types of investments there may be varying degrees of risk. Socially responsible investing does not guarantee any amount of success. Clients and prospective clients should be prepared to bear investment loss including loss of original principal. Indices mentioned are unmanaged and cannot be invested into directly. Past performance is not a guarantee of future results.
The Dow Jones Industrial Average (DJIA) is a price-weighted index composed of 30 widely traded blue-chip U.S. common stocks. The S&P 500 is a market-cap weighted index composed of the common stocks of 500 leading companies in leading industries of the U.S. economy. The NASDAQ Composite Index is a market-value weighted index of all common stocks listed on the NASDAQ stock exchange.
