Market Commentary | August 12th, 2024
Week in Review…
Following a volatile week, broad equity markets finished slightly lower for the week, after a weakening jobs payroll report and fears of weakening economic growth continue.
- The S&P 500 was down 0.04%
- The Dow Jones Industrial Average declined by 0.60%
- The Nasdaq Composite was lower by 0.18%
- The 10-Year Treasury closed at 3.94%

Crude oil inventories and the count of active oil rigs was released by the Energy Information Administration (EIA), measuring the weekly change in the number of barrels of commercial crude oil held by U.S. firms. The previous six weeks have shown signs of a continuous increase in demand due to readings being stronger than anticipated, which positively impacts inflation. Furthermore, the number of active rigs for the week was released, showing an addition of three rigs working compared to last week’s reading. An increase in the number of active rigs indicates that economists anticipate an increase in demand for petroleum.
Spotlight

ABS Market Update
With interest rates remaining high this year, this week we take a look at the Asset Backed Securities (ABS) sector and the rise in issuance this year in both consumer and business sectors.
A quick primer on the ABS sector: ABS are securities that are backed by income streams from assets such as auto loans, credit cards, student loans, and other income-generating assets. Over the years, the space has grown and has expanded into various assets such as equipment leases, royalties, franchise fees, solar panels, cell towers, and other esoteric assets.


Source: Securities Industry and Financial Markets Association, sifma.org
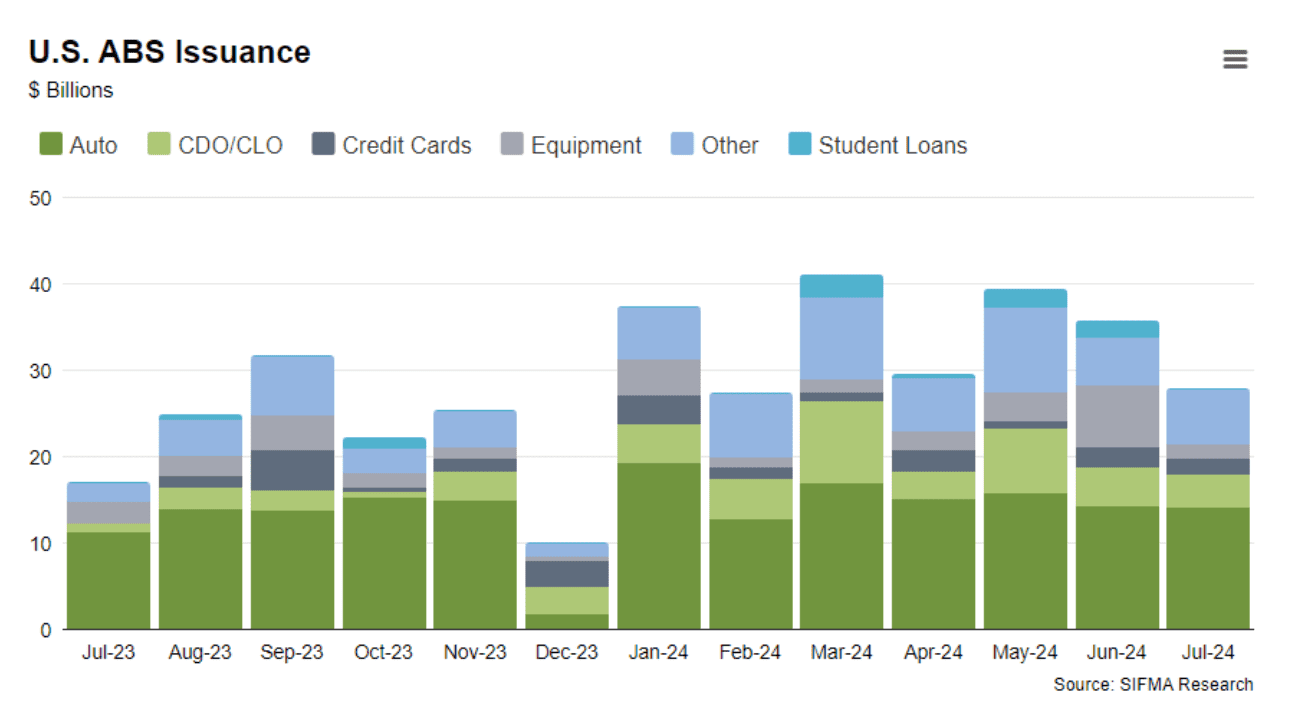
Looking at the past few years, issuance in the ABS space has declined since peaking in 2021, with Collateralized Debt/Loan Obligations (CDO/CLO) being the largest issuers during the post-COVID recovery period. Since then, the overall issuance in the space has declined as well as a shift away from business credit-to-consumer credit with auto loans leading in ABS issuance the past two years, a first since 2011.
Year to date (YTD), there has been a large upswing in ABS issuance. As of the end of July, overall issuance YTD is $237.5 billion, which is up 51.6% year-over-year. Through the end of the second quarter, ABS has been the highest in terms of percentage growth year-over-year versus the other major fixed income sectors.

Source: Securities Industry and Financial Markets Association, sifma.org
Looking below the surface, we see that auto loans continue to lead in overall issuance this year versus the other ABS sectors. Additionally, the more esoteric “Other” sector has outpaced issuance of CDO/CLOs. Overall, we see consumer focused sectors continue to outpace business or corporate focused CDO/CLO.

Source: Securities Industry and Financial Markets Association, sifma.org
Going forward, it’s important for investors to pay attention to the exposure of ABS in their fixed income allocations such as core or multi-sector bond funds and ETFs. The past two years, investors have invested more heavily into the ABS space to diversify exposure from more duration sensitive sectors such as treasuries and corporate credits. If we see a weakening consumer, there could be concerns in some of these consumer-focused sectors such as auto loans, credit cards, and student loans.
Week Ahead…

Midway through the week, the Core Consumer Price Index (CPI) for the month of July will measure the changes in the price of goods and services, excluding food and energy. Currently, the reading is forecasted to increase to a 0.2% change from the previous reading of a -0.1% change. Additionally, the Producer Price Index (PPI) for the month of July will be released, measuring the change in input prices of raw, semi-finished, or finished goods and services. If the PPI does increase more than forecasted like the previous month’s reading, a portion of the increased input costs will be pushed onto consumers, making the goods and services more expensive.
Later in the week, weekly continuing jobless claims will measure the number of unemployed people who continuously receive unemployment insurance benefits. For the previous two weeks, each week has increasingly measured more continuous unemployment claims compared to the previous reading. Economists will be watching to see if this trend continues. Furthermore, the University of Michigan will release their Consumer Expectations Index for the month of August, gauging consumers’ expectations of a hot or cold economy.
Investing involves risk. Depending on the different types of investments there may be varying degrees of risk. Socially responsible investing does not guarantee any amount of success. Clients and prospective clients should be prepared to bear investment loss including loss of original principal. Indices mentioned are unmanaged and cannot be invested into directly. Past performance is not a guarantee of future results.
The Dow Jones Industrial Average (DJIA) is a price-weighted index composed of 30 widely traded blue-chip U.S. common stocks. The S&P 500 is a market-cap weighted index composed of the common stocks of 500 leading companies in leading industries of the U.S. economy. The NASDAQ Composite Index is a market-value weighted index of all common stocks listed on the NASDAQ stock exchange.
