Weekly Market Commentary | January 6th, 2025
Week in Review…
Major U.S. equity indices were mostly lower this week after finishing 2024 with double-digit annual gains. For the week ending January 3, 2025:
- The S&P 500 closed down -0.48
- The Dow Jones Industrial Average declined by -0.60%
- The tech-heavy Nasdaq fell -0.51%
- The 10-Year Treasury yield concluded at 4.59%

Initial jobless claims fell to an eight-month low of 211,000 in the week ending December 28, 2024, down from 219,000 in the previous week. This decrease, along with a drop in continuing claims to 1.84 million, suggests a resilient labor market.
The National Association of REALTORS® reported that pending home sales rose by 2.2% in November 2024, marking the fourth consecutive month of increases. This growth, exceeding the forecast of 0.9%, indicates a potential rebound in the housing market. Year-over-year, pending home sales increased by 6.9%, with improvements across all four U.S. regions.
The Institute for Supply Management (ISM) reported a Manufacturing Purchasing Managers Index (PMI) of 49.3, which was slightly higher than the previous reading but still indicating contraction. The S&P Global Manufacturing PMI for December 2024 came in at 49.4, surpassing expectations but below the prior reading.
The Atlanta Fed’s GDPNow model estimates fourth-quarter 2024 real GDP growth at 2.4%, a slight decrease from its previous projection of 2.6% on January 2, 2025.
Spotlight

A Resilient 2024 – In the Rear View Mirror
Equity markets performed strongly in 2024, driven by economic growth and solid corporate earnings, particularly in the technology sector. Fixed income saw modest gains, with leveraged loans, high-yield bonds, and asset-backed securities demonstrating strong performance against the backdrop of a robust economy. Inflation remained a persistent concern throughout 2024. The Federal Reserve cut interest rates three times, shifting to a more accommodative stance to support economic stability amid cooling inflation.
Economic Highlights
Inflation remained a persistent concern in 2024, with U.S. headline inflation at 2.7% in November, above the Fed’s 2% target. In response, the Federal Reserve implemented three 25 basis point rate cuts, bringing the federal funds rate to 4.25%-4.5% by December, while projecting only two rate cuts for 2025.

The 10-year Treasury yield, a key economic indicator, fluctuated throughout 2024, starting below 3.9% and ending at 4.57%. Geopolitical tensions in Israel and Ukraine had a modest impact on capital markets, contributing to the dollar’s safe-haven status and influencing investor sentiment.
The U.S. dollar showed strength in early 2025, continuing its robust performance from 2024. Its strength was also partly attributed to the Fed’s stance, interest rate differentials, and expectations surrounding President-elect Trump’s pro-growth policies. Despite these challenges, the U.S. economy demonstrated resilience, with GDP growth reaching 3.1% in the third quarter of 2024.
Broad Asset Class Performance
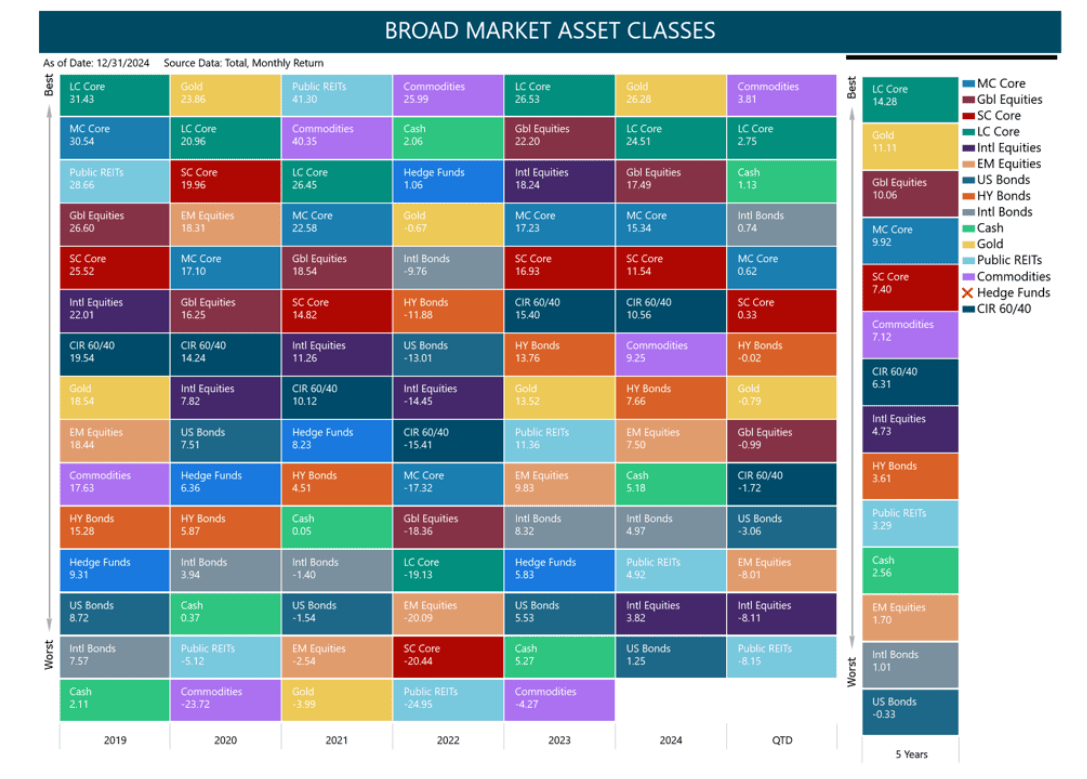
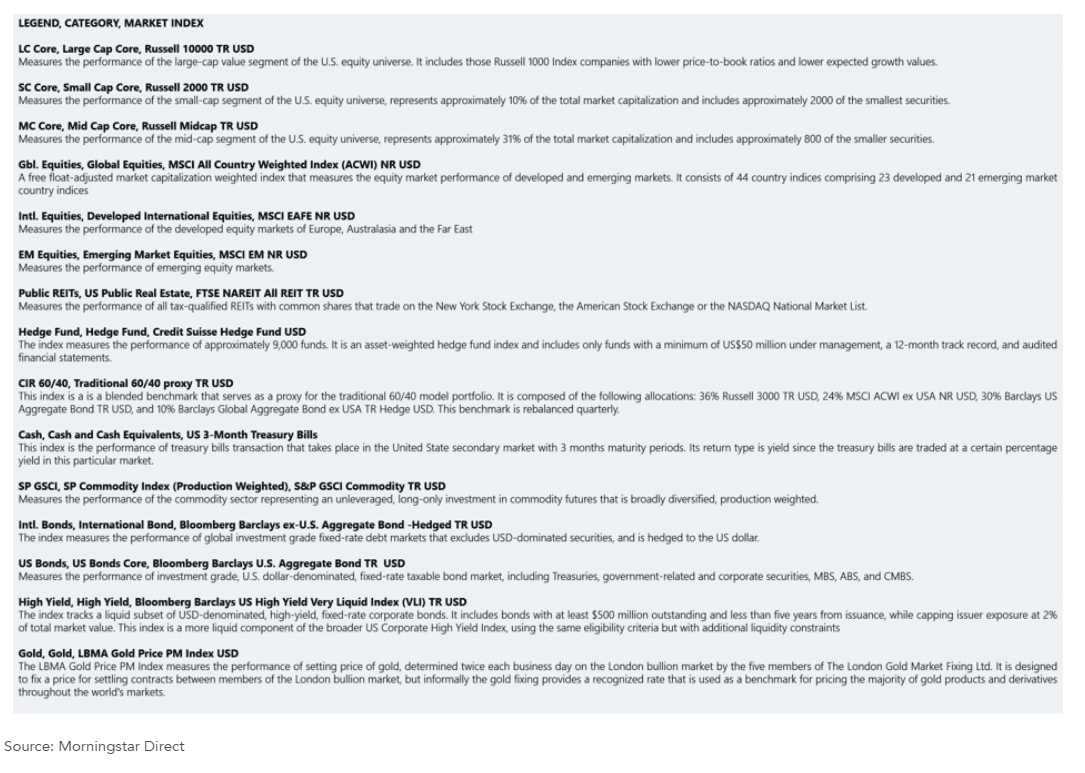
In 2024, Gold, Large Cap Core equities, and Global Equities emerged as top performers. U.S. Bonds underperformed, while Commodities, represented by the S&P GSCI, rallied in the fourth quarter. This rally was driven by gains in industrial metals, gold, and various agricultural commodities. U.S. real estate investment trusts (REITs) lagged behind the broader market in the last quarter of the year.
Equity Markets
Broad Equity Markets
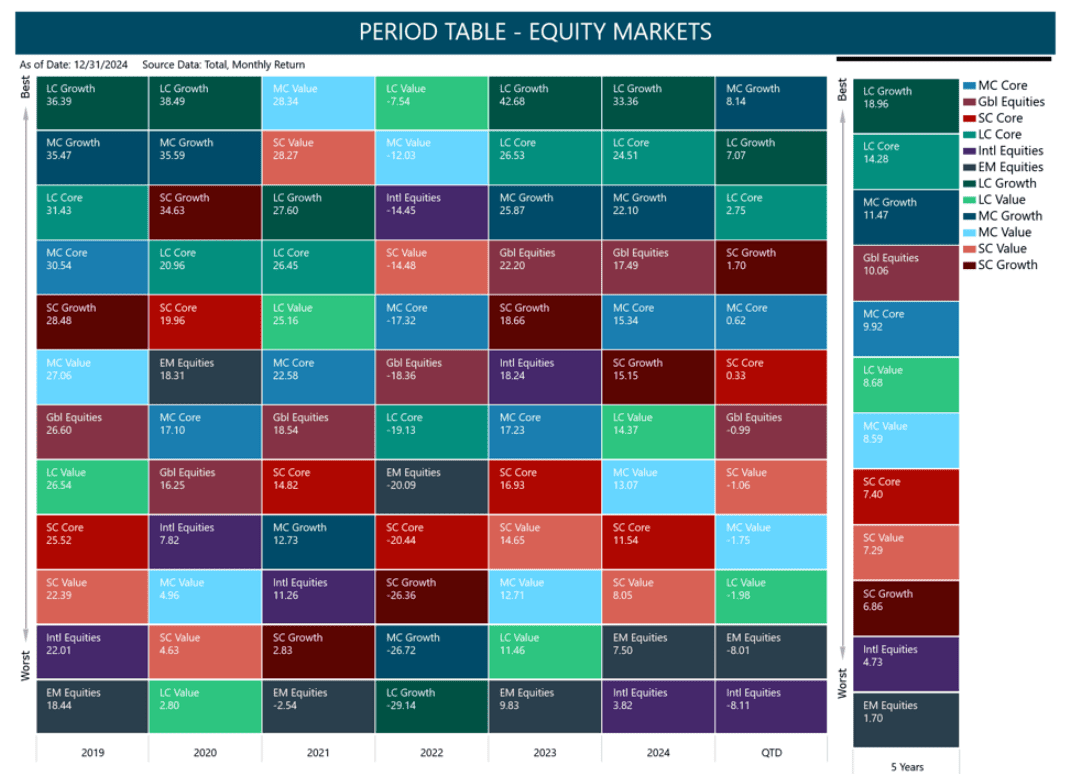
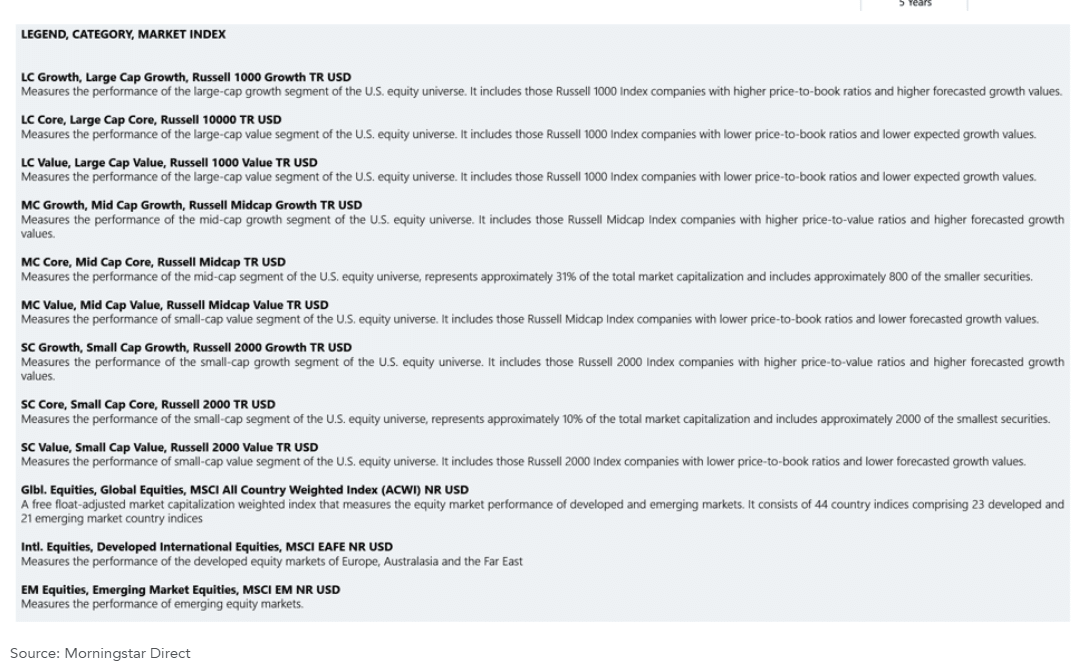
For 2024 and Q4 2024, Growth outperformed Core and Value, while U.S. Equities (represented by the Russell 3000) outperformed International Equities and Emerging Markets and (represented by MSCI EM and MSCI EAFE) on a Total Return basis (24.51% versus 7.50% versus 3.82%).
This outperformance was driven by the continued dominance of large tech companies, higher liquidity in the U.S. market, and faster earnings growth of U.S. companies compared to global counterparts. Notably, in Q4 2024, Mid Cap Growth (represented by Russell Mid Cap Growth) outperformed both Large Cap Growth and Small Cap Growth (8.14% versus 7.07% versus 1.70%).
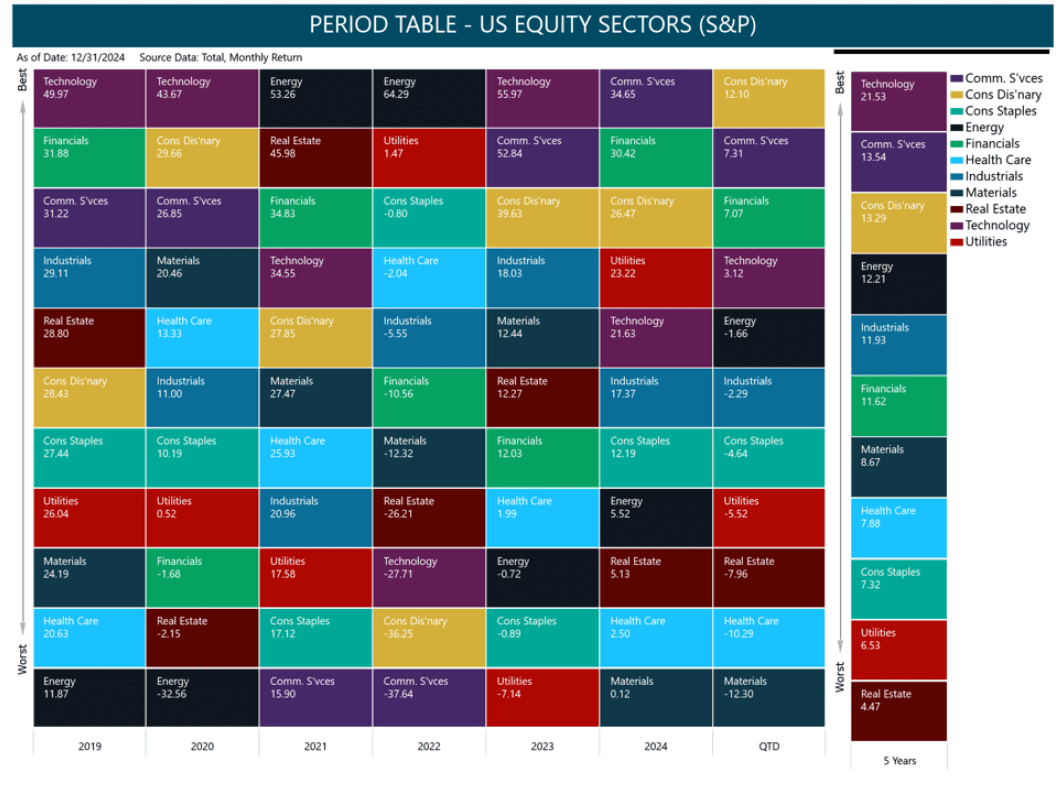
Communication Services, Financial Services, and Consumer Discretionary sectors emerged as the top performers for both the full year and the fourth quarter of 2024. The Communication Services sector delivered an impressive ~34% gain on a total return basis in 2024, significantly outpacing other sectors, primarily driven by strong investor interest in mega-cap tech companies and the advancements in artificial intelligence (AI) technologies. However, the Technology sector continues to outperform the other equity sectors on a trailing 5-year total return basis.
Fixed Income
Yield Curve and Corporate Spreads
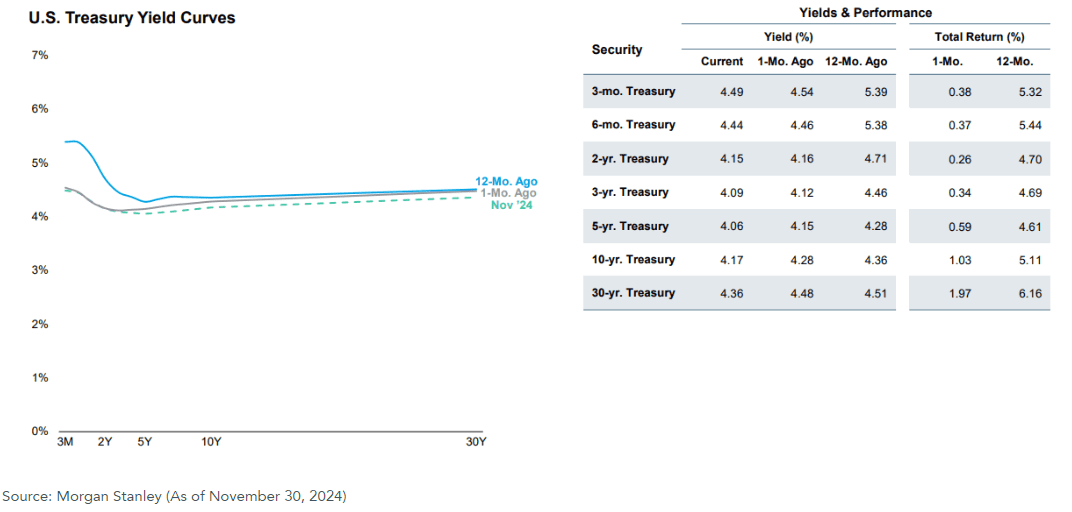
The U.S. Treasury yield curve was deeply inverted at the start of 2024 with short-term rates exceeding long-term rates. However, as the year progressed and towards the year end, the yield curve began to normalize slightly as long-term yields increased relative to short-term yields. This shift reflected market expectations for a more supportive monetary policy environment and reduced recession concerns.
Corporate credit spreads across all segments—including high yield bonds, investment-grade bonds, and leveraged loans—remained relatively stable throughout the fourth quarter of 2024. However, these spreads tightened significantly over the trailing 12-month period. This compression was due to improved risk appetite, expectations of continued economic growth, and anticipation of a supportive monetary policy environment.
Fixed Income Sectors
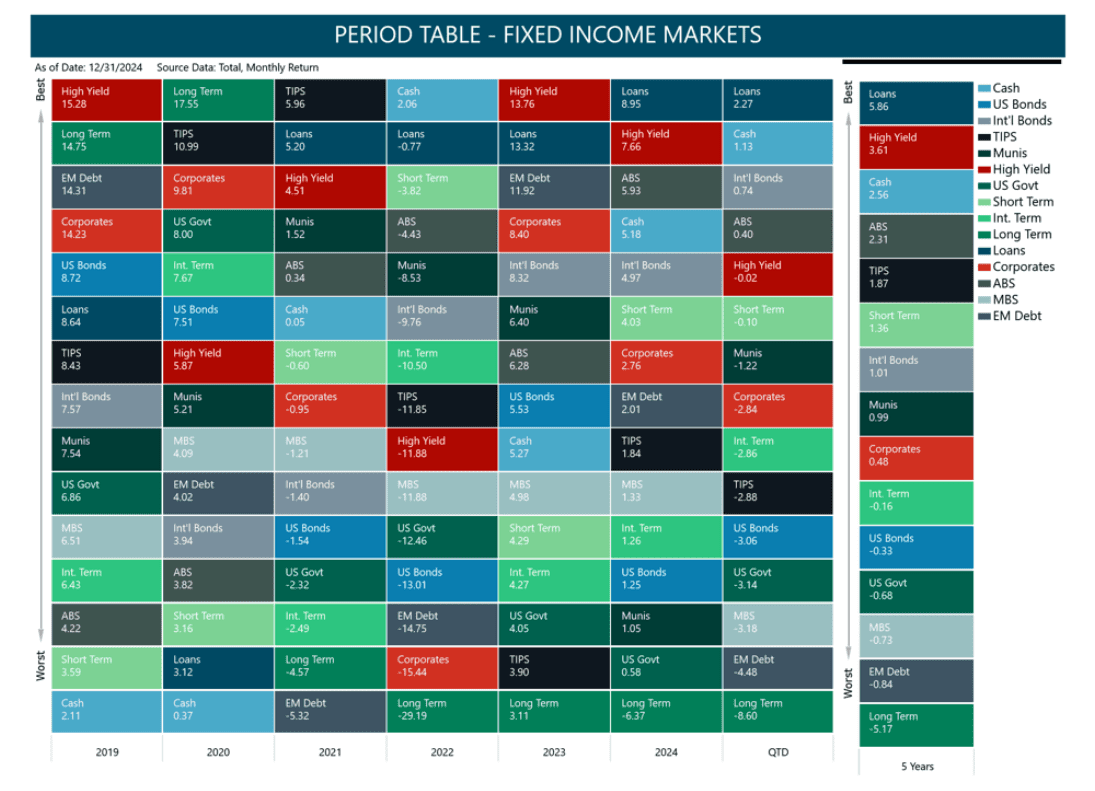
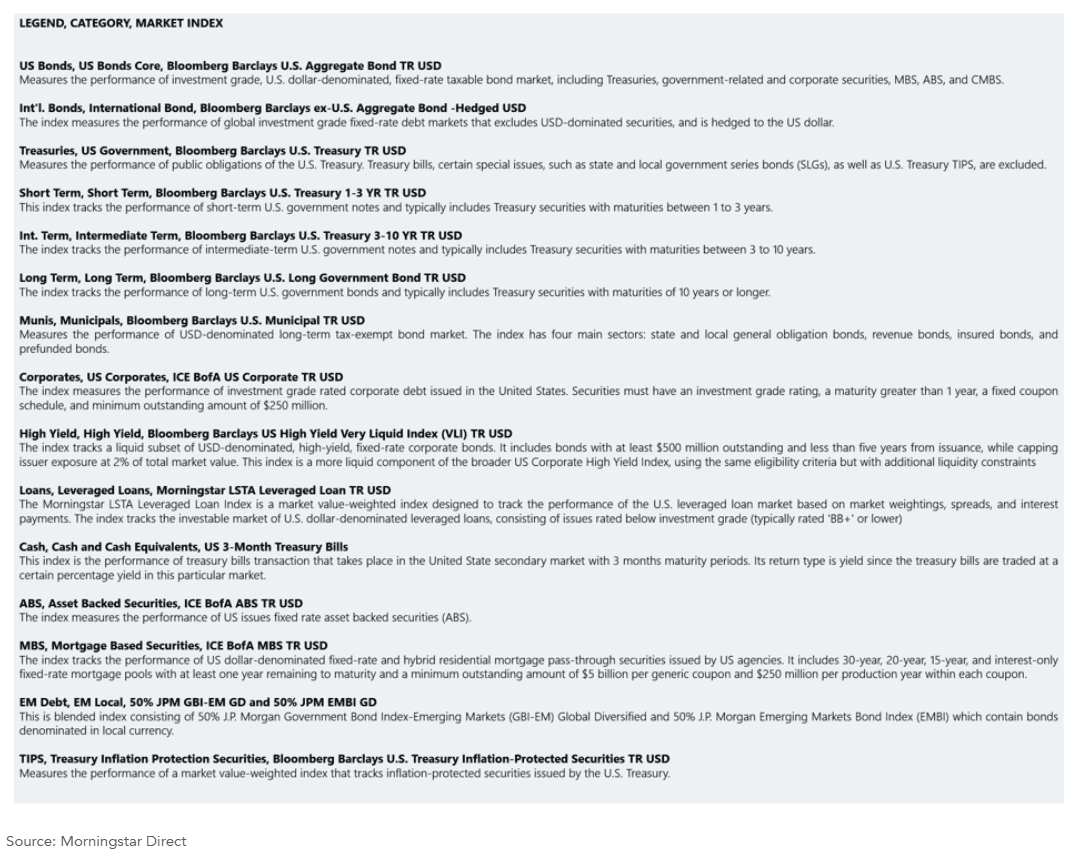
In 2024 and Q4 2024, leveraged loans, high-yield bonds, and asset-backed securities demonstrated strong performance, as reflected by their respective indices. The Morningstar Leveraged Loan LSTA TR index returned 8.95%, outpacing the Barclays US High Yield Very Liquid index at 7.66% and the ICE BofA ABS TR index at 5.93%. The strong performance of these riskier fixed-income assets can be attributed to factors such as expectations of Fed rate cuts, improving economic outlook, and investors’ search for yield in a changing rate environment.
Week Ahead…

Next week, employment data will be a key focus for investors. Several crucial economic reports will be released, providing insights into the labor market. On Tuesday, the Job Openings and Labor Turnover Survey (JOLTS) report will be released, followed by the ADP Nonfarm Employment Change report on Wednesday and Initial Jobless Claims on Thursday. However, Friday will be the most data-rich day, with the release of December’s figures for Average Hourly Earnings, Bureau of Labor Statistics Nonfarm Payrolls, Unemployment Rate, U6 Unemployment, and Participation Rate. It’s worth noting that initial jobless claims ended last year on a positive note, beating estimates for three consecutive weeks. Additionally, last month saw a divergence between ADP data and Nonfarm Payrolls, markets will monitor whether this discrepancy will persist.
On Friday, the University of Michigan will release four key consumer sentiment reports. The first two focus on consumer inflation expectations over one and five years. One-year expectations have recently remained within a narrow range of 2.6% to 2.8%, while five-year expectations have fluctuated between 3.0% and 3.2%. Markets will closely watch these figures for any signs of a shift in inflation expectations. The remaining two reports measure consumer expectations and overall sentiment. As the backbone of the economy, consumer confidence is a crucial indicator of economic activity. A positive surprise in these reports would bode well for both current and future economic growth.
Early next week, markets will focus on the service sector with the release of the S&P Global and ISM Services PMIs on Monday and Tuesday. As the U.S. economy is heavily reliant on services, these surveys will provide crucial insights into the health of the broader economy. A strong reading will likely boost confidence and support asset prices, while a weaker reading could raise concerns about economic growth.
This content was developed by Cambridge from sources believed to be reliable. This content is provided for informational purposes only and should not be construed or acted upon as individualized investment advice. It should not be considered a recommendation or solicitation. Information is subject to change. Any forward-looking statements are based on assumptions, may not materialize, and are subject to revision without notice. The information in this material is not intended as tax or legal advice.
Investing involves risk. Depending on the different types of investments there may be varying degrees of risk. Socially responsible investing does not guarantee any amount of success. Clients and prospective clients should be prepared to bear investment loss including loss of original principal. Indices mentioned are unmanaged and cannot be invested into directly. Past performance is not a guarantee of future results.
The Dow Jones Industrial Average (DJIA) is a price-weighted index composed of 30 widely traded blue-chip U.S. common stocks. The S&P 500 is a market-cap weighted index composed of the common stocks of 500 leading companies in leading industries of the U.S. economy. The NASDAQ Composite Index is a market-value weighted index of all common stocks listed on the NASDAQ stock exchange.

